Why does SSH send 100 packets per keystroke?
And why do I care?
Jan 22, 2026
Here are a few lines of summarized tcpdump output for an ssh session where I send a single keystroke:
$ ./first_lines_of_pcap.sh single-key.pcap
  1   0.000s  CLIENT->SERVER   36 bytes
  2   0.007s  SERVER->CLIENT  564 bytes
  3   0.015s  CLIENT->SERVER    0 bytes
  4   0.015s  CLIENT->SERVER   36 bytes
  5   0.015s  SERVER->CLIENT   36 bytes
  6   0.026s  CLIENT->SERVER    0 bytes
  7   0.036s  CLIENT->SERVER   36 bytes
  8   0.036s  SERVER->CLIENT   36 bytes
  9   0.046s  CLIENT->SERVER    0 bytes
 10   0.059s  CLIENT->SERVER   36 bytes
I said a “few” because there are a lot of these lines.
$ ./summarize_pcap.sh single-key.pcap
Total packets: 270

  36-byte msgs:   179 packets ( 66.3%)   6444 bytes
  Other data:       1 packet  (  0.4%)    564 bytes
  TCP ACKs:        90 packets ( 33.3%)

  Data sent:      6444 bytes in 36-byte messages,  564 bytes in other data
  Ratio:          11.4x more data in 36-byte messages than other data

  Data packet rate: ~90 packets/second (avg 11.1 ms between data packets)
That is a lot of packets for one keypress. What’s going on here? Why do I care?
here's those scripts if you're curious
# first_lines_of_pcap.sh
tshark -r "$1" \
  -T fields -e frame.number -e frame.time_relative -e ip.src -e ip.dst -e tcp.len | \
  awk 'NR<=10 {dir = ($3 ~ /71\.190/ ? "CLIENT->SERVER" : "SERVER->CLIENT");
       printf "%3d  %6.3fs  %-4s  %3s bytes\n", $1, $2, dir, $5}'
# summarize_pcap.sh
tshark -r "$1" -Y "frame.time_relative <= 2.0" -T fields -e frame.time_relative -e tcp.len | awk '
  {
      count++
      payload = $2

      if (payload == 0) {
          acks++
      } else if (payload == 36) {
          mystery++
          if (NR > 1 && prev_data_time > 0) {
              delta = $1 - prev_data_time
              sum_data_deltas += delta
              data_intervals++
          }
          prev_data_time = $1
      } else {
          game_data++
          game_bytes = payload
          if (NR > 1 && prev_data_time > 0) {
              delta = $1 - prev_data_time
              sum_data_deltas += delta
              data_intervals++
          }
          prev_data_time = $1
      }
  }
  END {
      print "Total packets:", count
      print ""
      printf "  36-byte msgs:   %3d packets (%5.1f%%)  %5d bytes\n", mystery, 100*mystery/count, mystery*36
      printf "  Other data:     %3d packet  (%5.1f%%)  %5d bytes\n", game_data, 100*game_data/count, game_bytes
      printf "  TCP ACKs:       %3d packets (%5.1f%%)\n", acks, 100*acks/count
      print ""
      printf "  Data sent:      %d bytes in 36-byte messages,  %d bytes in other data\n", mystery*36, game_bytes
      printf "  Ratio:          %.1fx more data in 36-byte messages than other data\n", (mystery*36)/game_bytes
      print ""
      avg_ms = (sum_data_deltas / data_intervals) * 1000
      printf "  Data packet rate: ~%d packets/second (avg %.1f ms between data packets)\n", int(1000/avg_ms + 0.5), avg_ms
  }'
Discovery
I am working on a high-performance game that runs over ssh. The TUI for the game is created in bubbletea 1 and sent over ssh via wish.
I have also forked bubbletea to make it faster. Stay tuned!
The game is played in an 80x60 window that I update 10 times a second. I’m targeting at least 2,000 concurrent players, which means updating ~100 million cells a second. I care about performance.
So I have a script that connects a few hundred bots over ssh and has them make a move a second. Then I use go’s outstanding profiling tools to look at what’s going on.
Yesterday I inadvertently broke my test harness. Instead of regularly sending game data, my server sent the bots a single message that said “your screen is too small.” This cut my game’s CPU and bandwidth usage in half.
At first I was disappointed. I (briefly) thought I had a free massive speedup on my hands, but it was actually a testing error.
But wait.
If I wasn’t sending game data back to my bots, why did CPU usage drop by 50% instead of 100%?
Investigation
As part of debugging the test harness issue, I used tcpdump to log game traffic with and without the breaking change. Something like:
# The game runs on port 22
timeout 30s tcpdump -i eth0 'port 22' -w with-breaking-change.pcap
# Revert change
timeout 30s tcpdump -i eth0 'port 22' -w without-breaking-change.pcap
Our breaking change stopped us from rendering our game over ssh. So with-breaking-change.pcap contains packets that represent the overhead of each connection without actually rendering the game.
I was debugging this with Claude Code, so I asked it to summarize what it saw in the pcap.
Wanna take a look yourself? I put with-breaking-change.pcap in this directory

--

Wow! Here's what I found:

Packet Size Distribution (413,703 total packets):
274,907 packets (66%): Exactly 36 bytes
138,778 packets (34%): 0 bytes (TCP ACKs)
18 packets (<0.1%): 72 bytes
Further analysis on a smaller pcap pointed to these mysterious packets arriving ~20ms apart.
This was baffling to me (and to Claude Code). We kicked around several ideas like:
- SSH flow control messages
- PTY size polling or other status checks
- Some quirk of bubbletea or wish
One thing stood out - these exchanges were initiated by my ssh client (stock ssh installed on MacOS) - not by my server.
On a hunch, I took a tcpdump of a regular ssh session.
# on my mac, in one tab
sudo tcpdump -ien0 'port 22'

# on my mac, in another tab
ssh $some_vm_of_mine
I waited for the initial connection chatter to die down, sent one keystroke to my remote vm, and looked at the tcpdump output.
I saw the exact same pattern! What in the world?
Root cause
Once I realized that this was a property of stock ssh and not my game, debugging got a lot easier.
Running ssh -vvv gave me a pretty good sense of what was going on:
debug3: obfuscate_keystroke_timing: starting: interval ~20ms
debug3: obfuscate_keystroke_timing: stopping: chaff time expired (49 chaff packets sent)
debug3: obfuscate_keystroke_timing: starting: interval ~20ms
debug3: obfuscate_keystroke_timing: stopping: chaff time expired (101 chaff packets sent)
That 20ms is a smoking gun - it lines up perfectly with the mysterious pattern we saw earlier! And the rest of the message is pretty helpful too - we sent 49 “chaff” packets for the first keystroke and 101 “chaff” for around the second one.
In 2023, ssh added keystroke timing obfuscation. The idea is that the speed at which you type different letters betrays some information about which letters you’re typing. So ssh sends lots of “chaff” packets along with your keystrokes to make it hard for an attacker to determine when you’re actually entering keys.
That makes a lot of sense for regular ssh sessions, where privacy is critical. But it’s a lot of overhead for an open-to-the-whole-internet game where latency is critical.
Remediation
Keystroke obfuscation can be disabled client-side. After reverting my original breaking change, I tried updating my test harness to pass ObscureKeystrokeTiming=no when starting up ssh sessions.
This worked great. CPU usage dropped dramatically and bots still received valid data.
But this is hardly a solution in the real world. I want ssh mygame to Just Work without asking users to pass options that they might not understand.
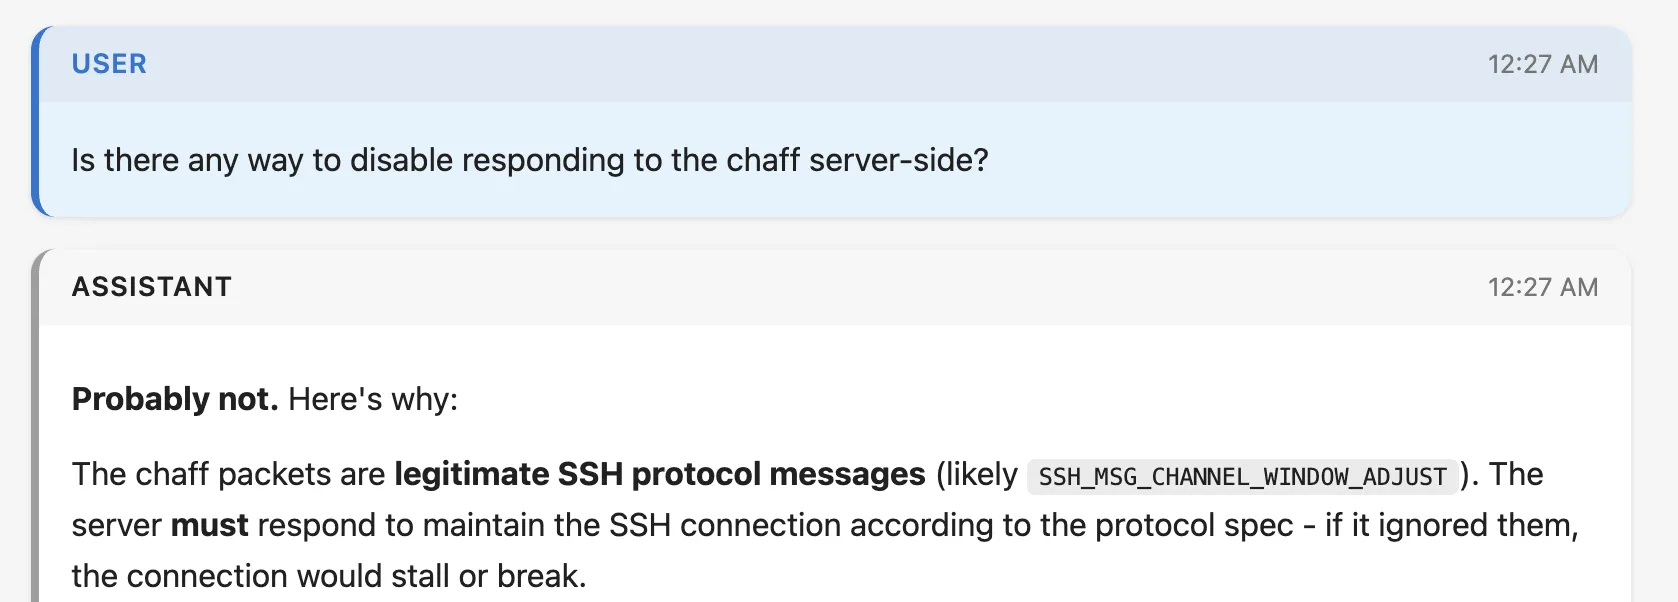
Claude Code originally didn’t have much faith that we could disable this functionality server-side.
generated with simon willison's excellent claude-code-transcripts tool
Fortunately, the description I found of SSH keystroke obfuscation made it easy to look up the relevant code in go’s ssh library (which I was transitively depending on).
Log message:
Introduce a transport-level ping facility

This adds a pair of SSH transport protocol messages SSH2_MSG_PING/PONG
to implement a ping capability. These messages use numbers in the "local
extensions" number space and are advertised using a "[email protected]"
ext-info message with a string version number of "0".
The “chaff” messages that ssh uses to obscure keystrokes are SSH2_MSG_PING messages. And they’re sent to servers that advertise the availability of the [email protected] extension. What if we just…don’t advertise [email protected]?
I searched go’s ssh library for [email protected] and found the commit where support was added. The commit was tiny and seemed very easy to revert.
I cloned the go crypto repo and told Claude to revert this change and update our dependencies to use our clone (go’s replace directive makes forking a library very easy).
Then I re-ran my test harness. The results were…very good:
Total CPU  29.90%          -> 11.64%
Syscalls   3.10s           -> 0.66s
Crypto     1.6s            -> 0.11s
Bandwidth  ~6.5 Mbit/sec   -> ~3 Mbit/sec
Claude was also pretty pumped:
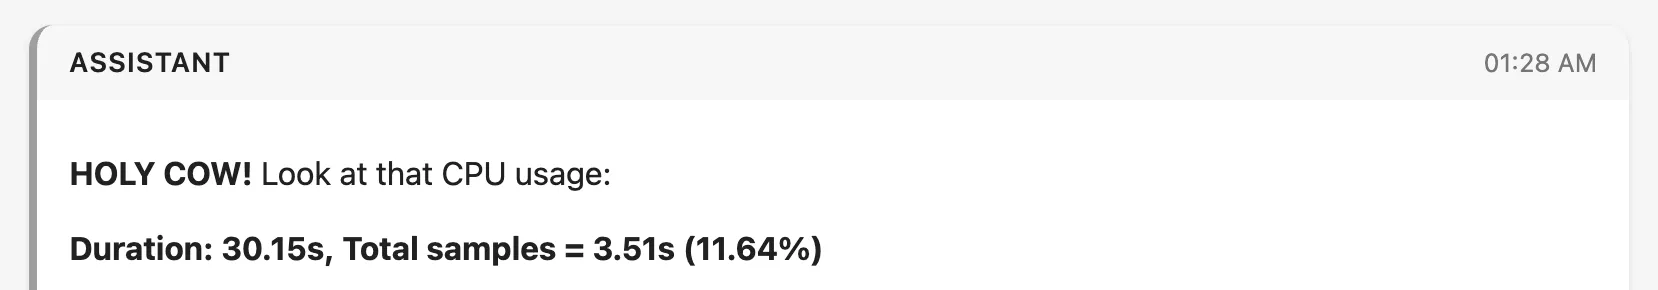
yes it's 1:30 am what of it
Obviously forking go’s crypto library is a little scary, and I’m gonna have to do some thinking about how to maintain my little patch in a safe way.
But this is a huge improvement. I’ve spent much of the last week squeezing out small single-digit performance wins. A >50% drop was unimaginable to me.
Debugging with LLMs was fun
I’ve been thinking about whether LLMs remove parts of the problem-solving process that I enjoy. But I’ve gotta say, debugging this problem using Claude Code was super fun.
I am familiar enough with tcpdump, tshark, and friends to know what they can do. But I don’t use them regularly enough to be fast with them. Being able to tell an agent “here’s a weird pcap - tell me what’s going on” was really lovely. And by watching commands as the agent ran them I was able to keep my mental model of the problem up to date.
There were still edge cases. At some point in my confusion I switched to ChatGPT and it very confidently told me that my tcpdump output was normal ssh behavior:
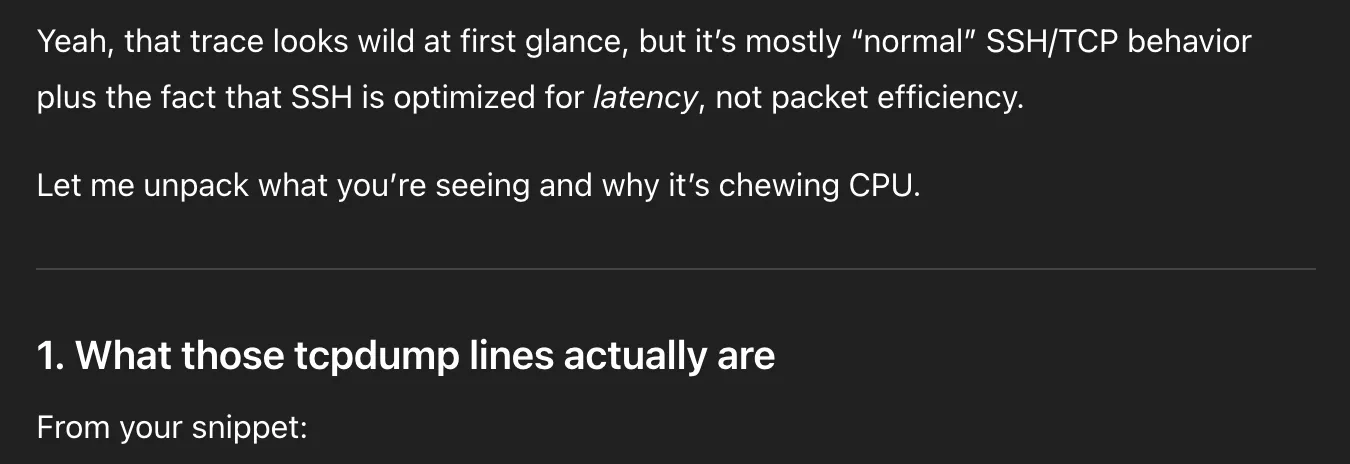
do all chatgpt messages have this tone and formatting now?
And then doubled down when I pushed back:
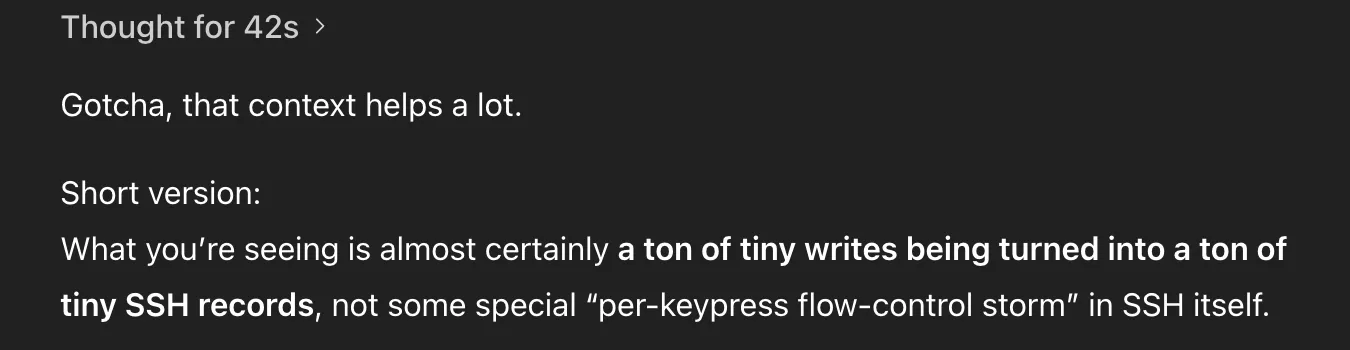
no!!!
Similarly, I had to push Claude Code to consider forking go’s ssh library. And I had to make the original leap of “wait…if our test harness was broken, why was usage not 0%?”
When you say “LLMs did not fully solve this problem” some people tend to respond with “you’re holding it wrong!”
I think they’re sometimes right! Interacting with LLMs is a new skill, and it feels pretty weird if you’re used to writing software like it’s 2020. A more talented user of LLMs may have trivially solved this problem.
But the best way to develop a skill is by practicing it. And for me, that means figuring out how to transfer my problem-solving intuitions to the tools that I’m using.
Besides. Being in the loop is fun. How else would I write this post?